


Track six numbers first: prime cost, food cost percentage, labor cost percentage, sales per labor hour, average check, and covers. Check sales, labor, and covers daily; check food cost and prime cost weekly. The immediate move is to build a 12-number dashboard you can scan in 15 seconds every Monday morning, because cost pressure across the industry in 2026 means waiting a month to notice a margin slide is no longer affordable.
***
TL;DR:
>
- Building a 12-number dashboard with key metrics like prime cost, food cost trend, and sales per labor hour enables quick weekly scans and early problem detection. - Comparing each metric to your own four-week trailing average, rather than industry benchmarks, helps identify true operational issues swiftly. - Focusing on internal adjustments such as inventory counts, portion control, and schedule forecasting often fixes problems faster than renegotiating vendor contracts or raising prices. - Integrating data from POS, reservations, and loyalty systems into one platform reduces manual work and ensures timely, accurate insights. - Daily checks on sales, labor, and voids plus a 15-minute weekly huddle keep the team aligned and responsive to small shifts before they impact margins.
***
Table of Contents
- The Restaurant KPIs That Actually Move Profit
- How to Calculate Every Core Metric and Where the Data Lives
- Building a 12-Number Dashboard You Can Read in 15 Seconds
- The Fastest Fixes for Each Core Metric
- Where an Integrated Platform Closes the Data Gaps
- Waste and Spoilage: The Metric Hiding Inside Your Food Cost
- Marketing Analytics: Campaign ROI and Digital Engagement
- What I'd Check Every Day, and How to Run the Weekly Huddle
- Get Your Dashboard Running Without the Commission Drag
- Sources
- FAQ
The Restaurant KPIs That Actually Move Profit
Most restaurant owners track too many numbers and act on too few. You don't need forty metrics on a spreadsheet nobody reads. You need a handful that tell you, at a glance, whether the business is healthy or bleeding, and you need to know what "bad" looks like before it happens.
Prime cost is the single most useful number in the entire operation. It is the sum of your cost of goods sold (food and beverage) plus total labor costs, divided by total sales. Full service concepts generally aim for a prime cost in a moderate range that reflects typical margins. If prime cost climbs notably above typical levels for your concept for an extended period, something structural is likely wrong and needs immediate diagnosis.
Food cost percentage is where most operators start, and it's calculated as cost of goods sold divided by food sales. There are two ways to get there: inventory-based (beginning inventory plus purchases minus ending inventory, divided by sales) and purchase-based, which just tracks what you bought against what you sold without a physical count. Purchase-based is faster but sloppier. It hides portion drift, over-pouring, and theft because it assumes everything you bought got sold at full price. If your purchase-based food cost looks fine but your plate costs on paper suggest it should be two points lower, you likely have a portioning problem, not a pricing problem.
Healthy food cost percentage varies by concept due to differing ingredient costs and pricing. For example, steakhouses often have higher food cost percentages compared to pizza concepts due to more expensive ingredients. Rather than focus on a fixed target, watch for upward trends in food cost without corresponding menu or vendor price changes, which typically indicate issues such as waste, theft, or portion creep.
Labor cost percentage tells you what you're spending on staff relative to sales, but it lies to you on slow days and lies to you on fast ones too, which is why sales per labor hour is the more diagnostic number. SPLH is total sales divided by total labor hours worked in that period. The important discipline here: don't compare your SPLH to some generic industry figure you found online. Compare it to your own trailing four-week average. If SPLH drops 10% below your own baseline on a Tuesday lunch, that's a scheduling problem, not a bad-luck problem.
- Prime cost: typical ranges vary by concept; a sustained rise above usual levels warrants investigation.
- Food cost percentage: varies by concept; a sudden significant increase without pricing or vendor changes suggests waste or portion issues.
- Labor cost percentage: varies widely; best interpreted alongside sales per labor hour rather than alone.
- SPLH: compare against your own recent history rather than generic external benchmarks.
- Average check: monitoring by daypart reveals operational insights beyond daily totals.
Average check, covers, and RevPASH round out the top tier. Average check is total sales divided by number of transactions or covers. Watching it daily tells you almost nothing. Watching it by daypart tells you everything. A dinner average check that's flat for three months while food costs rise means your team has stopped upselling, or your menu pricing hasn't kept pace with food inflation. Covers (your guest count) tracked against the same day last week, not last year, exposes traffic problems fast enough to actually fix them.
RevPASH, revenue per available seat hour, calculates total revenue divided by the product of seats and hours open, capturing seat utilization efficiency across the shift. It complements average check by indicating whether tables are being turned efficiently, particularly important during peak hours. Low RevPASH despite strong average checks suggests slow table turnover that limits overall revenue potential.
Quick Stat: NetSuite's catalog of restaurant metrics groups 33 distinct KPIs into financial, operational, performance, and customer categories, a reminder that the six or so numbers above are a starting filter, not the whole picture.
Customer metrics deserve a place in this tier too, even though they're softer than a cost percentage. Retention rate (the share of guests who return within a set window), visit frequency, and a basic satisfaction signal like Net Promoter Score or your average online review rating all feed back into revenue eventually.
Pro Tip: *Pull your SPLH for the same daypart across four consecutive weeks before you touch a schedule. One bad Tuesday means nothing. Four bad Tuesdays in a row is a staffing pattern you can actually fix.*
How to Calculate Every Core Metric and Where the Data Lives
Formulas only matter if you know where the raw numbers come from. Here's the mapping most operators are missing, section by section.
- Prime cost = (Total Cost of Goods Sold + Total Labor Cost) ÷ Total Sales. COGS comes from your inventory management system or manual counts; labor comes from payroll or your scheduling software; sales comes from your POS.
- Food cost percentage = (Beginning Inventory + Purchases − Ending Inventory) ÷ Food Sales. This needs an actual physical count, not just invoices, or you're doing purchase-based tracking and missing waste.
- Labor cost percentage = Total Labor Cost ÷ Total Sales. Pull labor cost from payroll software, ideally one that separates front-of-house from back-of-house so you can diagnose which side is bloated.
- SPLH = Total Sales ÷ Total Labor Hours. Both numbers usually live in your POS and scheduling system, and most modern POS platforms will calculate this automatically if you set the daypart windows correctly.
- RevPASH = Total Revenue ÷ (Total Seats × Hours Open). Seat count is fixed data you enter once; revenue and hours come from your POS and reservation system.
- Contribution margin per cover = (Sales − Variable Costs) ÷ Covers. This requires knowing your variable cost per dish, which comes from recipe costing in your inventory system.
- Breakeven point = Fixed Costs ÷ Contribution Margin Percentage. Fixed costs come from your accounting software (rent, insurance, base salaries); contribution margin comes from the calculation above.
- Days cash on hand = Cash on Hand ÷ (Annual Operating Expenses ÷ 365). This one lives entirely in accounting software and should be checked weekly during any period of cost volatility.
| Metric | Primary Data Source | Recommended Cadence |
|---|---|---|
| Prime cost | POS + inventory system + payroll | Weekly |
| Food cost % | Inventory counts + purchase invoices | Weekly |
| Labor cost % | Payroll / scheduling software | Daily to weekly |
| SPLH | POS + scheduling software | Daily |
| Average check / covers | POS | Daily |
| RevPASH | POS + reservation system | Weekly |
| Days cash on hand | Accounting software | Weekly |
The cadence question comes up constantly, and the industry guidance is consistent: sales, labor, and cover counts need daily eyes because they change daily and small drifts compound fast. Food cost and prime cost work fine on a weekly rhythm because inventory counts are labor intensive and daily counts add more noise than signal. Cash forecasting should refresh weekly too, especially during periods when vendor prices are moving.
Automating this refresh cycle is less about fancy software and more about consistency. If your POS, inventory system, and payroll software don't talk to each other, someone on your team is manually copying numbers into a spreadsheet every week, and that's exactly the kind of task that gets skipped when the restaurant gets busy, which is precisely when you need the data most.
Pro Tip: *Set a recurring calendar block, same day, same time, every week, for pulling these numbers. Data that gets collected "whenever there's time" gets collected never.*
Building a 12-Number Dashboard You Can Read in 15 Seconds
A dashboard with 40 metrics on it is a dashboard nobody checks. The practical fix, backed by a layout built around four quadrants, is to cap your screen at 12 numbers: three each for sales, cost, profitability, and cash. It’s tight enough to scan in the time it takes to drink your coffee, and comprehensive enough to catch a problem before it becomes a crisis.
Sales quadrant: total sales, average check, and covers, each compared to the same day or week last period. Cost quadrant: food cost percentage, labor cost percentage, and prime cost. Profitability quadrant: contribution margin per cover, RevPASH, and net margin. Cash quadrant: days cash on hand, accounts payable aging, and a rolling 13-week cash forecast total.
- Sales down 8% week-over-week with flat labor hours: overstaffing alert, adjust next week's schedule immediately.
- Food cost up 2 percentage points from your trailing 4-week average with no vendor price change: portion or waste investigation.
- Prime cost above 65% (full service) for two straight weeks: full menu and labor triage, not a one-off fix.
- Days cash on hand below 15: escalate to ownership same day, freeze discretionary spending.
The trick that separates a useful dashboard from a noisy one is comparing every number to your own trailing average, not a fixed industry benchmark. Databox's guidance on this is blunt: a dashboard without alert thresholds is just decoration. Set a percent-change trigger, food cost up 2 points, sales down 8%, and let the dashboard flag deviations rather than making a human stare at raw numbers every week hoping to spot a pattern.
Ownership matters as much as design. The general manager owns the sales and cost quadrants. The kitchen manager or chef owns food cost drift specifically. Whoever handles accounting or bookkeeping owns the cash quadrant. When a number trips a red flag, it should go to one named person, not "the team," or it gets ignored.
The Fastest Fixes for Each Core Metric
Once you know which number is off, the fix usually falls into one of four buckets. Here's the priority order that gets results fastest.
- Fix food cost with cadence before you touch pricing. Move from monthly to weekly inventory counts first. Most food cost overages get caught within two weeks of tightening count frequency, before you ever need to renegotiate with a vendor or raise a price. Reducing waste and tightening inventory efficiency remains one of the highest-leverage moves available, because a one-point improvement in food cost often outweighs an entire month of marketing spend.
- Audit portion control on your five highest-volume dishes. These five items usually drive 40% or more of your food cost exposure. A quarter-ounce of portion creep on your top burger, multiplied by 300 covers a week, adds up fast.
- Renegotiate with vendors only after you've fixed internal waste. Vendors will always blame market pricing. Sometimes they're right. But you can't tell the difference until your own house is in order.
- Adjust menu mix toward higher-margin items. Menu engineering isn't about cutting your worst seller. It's about repositioning your best-margin items into the spots on the menu guests look at first.
- Schedule to forecasted dayparts, not to a fixed weekly template. If Thursday lunch consistently runs light, stop scheduling it like Friday lunch. Use your SPLH trend by daypart to build the next week's schedule, not last month's habit.
- Use cross-trained floats instead of adding bodies. A server who can also run food or bus tables during a rush covers gaps without adding a full labor line.
- Cap overtime by watching labor hours daily, not at the end of the pay period. Overtime creep is invisible until the paycheck; daily tracking catches it while there's still time to adjust the schedule.
- Target weak dayparts with specific promotions, not blanket discounts. A bundle deal aimed at a slow Tuesday dinner does more for RevPASH than a 10% off coupon that also discounts your busiest Saturday night.
- Reconcile every third-party channel's fees weekly against contribution margin, not gross sales. A dollar of delivery revenue and a dollar of dine-in revenue aren't the same dollar once you subtract commission; some channels look busy and actually lose money.
- Tighten comp and void approval before you tighten anything else. Uncontrolled comps are one of the most common, least monitored sources of margin leakage in independent restaurants.
Pro Tip: *When a red flag trips, run it through a fast triage: confirm the data is accurate first (recount inventory, check for a void spike), then narrow the cause to menu, labor, or vendor, then deploy a fix within seven days. Two weeks of "we'll watch it" is how a two-point problem becomes a ten-point problem.*
Where an Integrated Platform Closes the Data Gaps
Most of the friction in restaurant analytics doesn't come from not knowing what to measure. It comes from the numbers living in five different systems that don't talk to each other, a POS for sales, a separate app for reservations, a spreadsheet for loyalty, a text thread for tips. An integrated platform was built around collapsing that fragmentation into one dashboard.
- Online ordering through multiple channels feeds directly into sales and average check data, so daypart-level average check tracking doesn't require pulling numbers from separate ordering channels.
- Reservation management across common platforms gives you covers and table turnover data in the same place you're watching sales, which makes RevPASH tracking far less manual.
- A standalone Tips feature, where individual workers collect tips directly to their own account via QR code, can give managers a signal on service quality by staff member, useful context when SPLH numbers look off and you're trying to separate a scheduling problem from a service problem.
- Digital loyalty cards integrated into mobile wallets make retention and visit frequency, the customer metrics that predict revenue two quarters out, trackable without a third-party loyalty vendor.
Because the site and ordering system deploy quickly after application confirmation, restaurants get a working data pipeline fast instead of waiting weeks for a traditional build. That speed matters more than it sounds. A dashboard is only as good as the data feeding it, and gaps in that feed are usually what kill an analytics habit before it starts.
Waste and Spoilage: The Metric Hiding Inside Your Food Cost
Waste percentage rarely gets its own line on an owner's dashboard, but it's usually the real driver behind a food cost number that won't come down no matter how many times you tweak recipes. Waste percentage is calculated as the dollar value of spoiled, discarded, or unusable inventory divided by total food purchases for the period.
The most common blind spot is treating waste as a kitchen problem when it's often a purchasing problem. Over-ordering perishables because a vendor offered a bulk discount looks like savings on the invoice and shows up as spoilage a week later.
Spoilage logs work best as a daily five-minute habit for whoever closes the kitchen, not a weekly audit. Write down what got thrown out and why: over-prepped, past date, damaged in delivery. After a month, patterns emerge that a monthly inventory count alone won't show you, like a specific vendor whose produce consistently arrives with a shorter shelf life than promised.
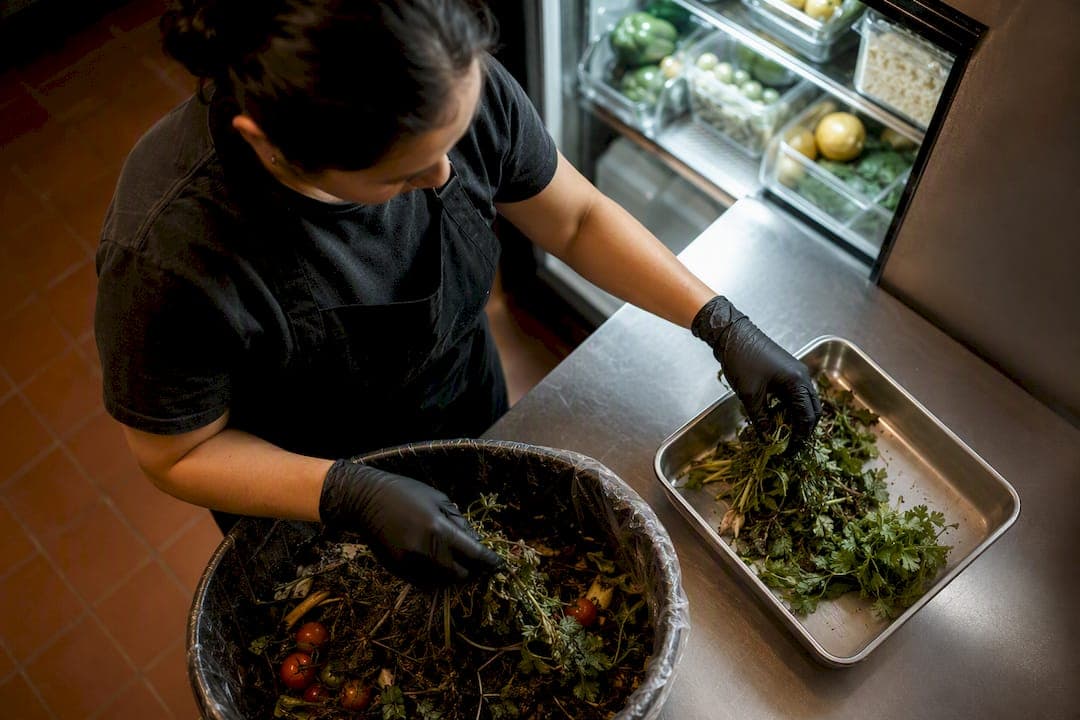
The fix that pays off fastest is usually portion-batching prep to actual forecasted covers instead of a fixed daily quantity. A kitchen that preps 40 portions of a special every day regardless of Tuesday's lighter traffic is manufacturing its own waste problem on a schedule.
Marketing Analytics: Campaign ROI and Digital Engagement
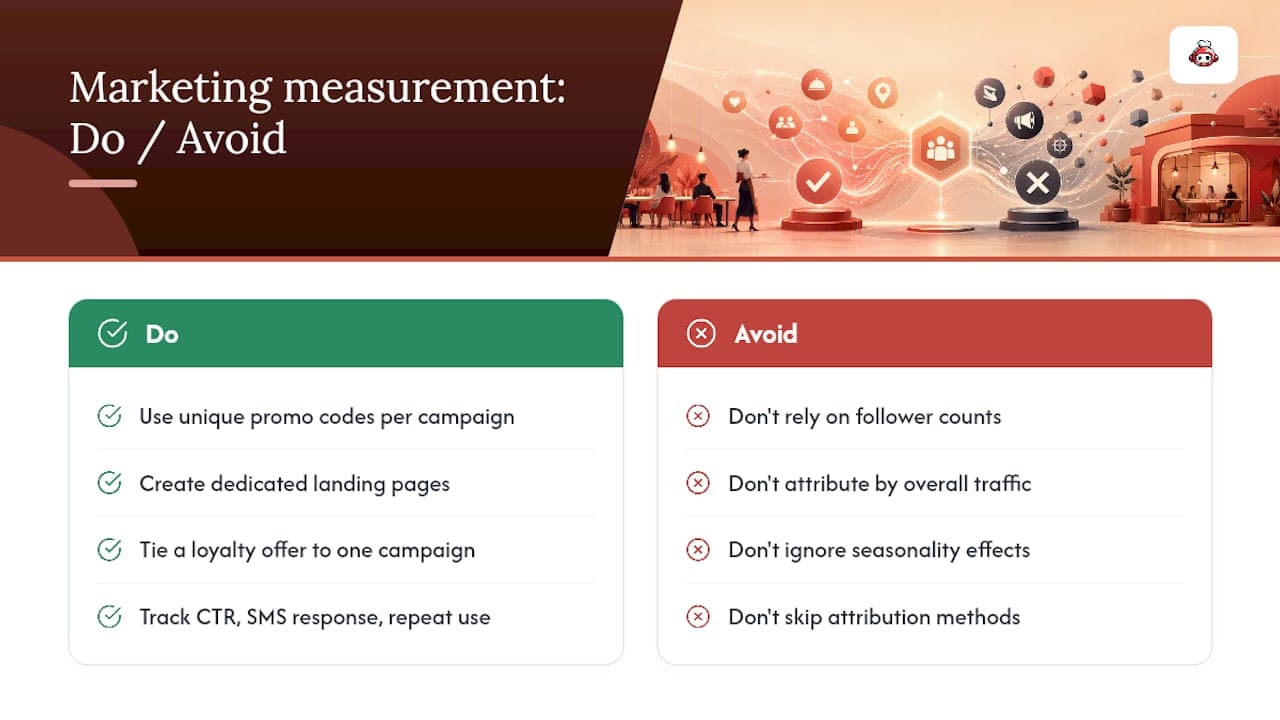
Marketing spend without a return metric attached is just an expense. Campaign ROI for a restaurant is calculated as (Revenue Attributed to Campaign − Campaign Cost) ÷ Campaign Cost, and the hardest part is the attribution, not the math.
The fix is tighter than most owners expect: unique promo codes, dedicated landing pages, or a specific loyalty offer tied to a single campaign let you isolate which sales actually came from that push rather than guessing based on a busier week. A Thursday email blast that coincides with a slow-season traffic dip generally, for instance, can look like it failed when it actually just got buried by seasonality.
Digital engagement metrics, click-through rate on promotional emails, response rate on SMS offers, and repeat use of a loyalty offer, tend to predict revenue better than vanity numbers like social media follower counts.
Review volume and rating trend belong in marketing analytics too, since online reputation increasingly functions as a marketing channel rather than just a customer service afterthought. A rating that slips from 4.6 to 4.3 over two months, even with the same food quality, tends to show up in covers within a quarter as new-guest discovery slows on search and map platforms.
What I'd Check Every Day, and How to Run the Weekly Huddle
Every morning, before anything else, check three numbers: net sales against your run rate for the day, labor percentage against forecast, and open voids or comps from the previous shift. That takes under two minutes and catches most problems while they're still small.
The weekly huddle should run 15 minutes, no longer, and follow the 12-number dashboard in order: sales quadrant first, cost quadrant second, profitability third, cash last. Assign one person to read each quadrant out loud and flag anything that's crossed a threshold. Don't discuss anything that's within normal range. That's the whole point of setting thresholds in the first place.
Ownership should never sit with one person for long. Rotate who "owns" reading a quadrant each month so more than one manager understands the full picture, and so the habit survives when someone takes a vacation or leaves the job. A dashboard that only one person knows how to read isn't a system. It's a single point of failure with a spreadsheet attached.
*— ADMIN*
Get Your Dashboard Running Without the Commission Drag
Most of the KPIs in this article assume your sales, ordering, and reservation data already live in one place. For a lot of independent restaurants, they don't, and that gap is exactly what makes weekly tracking feel like extra work instead of a five-minute habit.
The site and ordering system go live within a day of your application being confirmed, which means you can start feeding real numbers into a 12-number dashboard this week instead of next quarter. If commission fees on third-party platforms are already eating into your prime cost calculations, commission-free ordering is worth a direct comparison against what you're paying now. Visit RESTOBOT to see the dashboard and set up a demo.
Sources
For deeper dives into the numbers covered here, these sources are worth bookmarking:
- Sales per labor hour (SPLH) — Black Box Intelligence
- Persistent cost increases and enduring demand will shape the restaurant industry in 2026 — National Restaurant Association
- 33 Restaurant Metrics: How to Calculate & Analyze — NetSuite
- Restaurant KPI dashboard guidance — Databox
- Restaurant Financial Dashboard: The 12 Numbers That Belong on One Screen — Restaurant Bottomline
FAQ
What are the most important KPIs for restaurants?
Prime cost, food cost percentage, labor cost percentage, sales per labor hour, average check, and covers form the core set most operators should track first, with cash on hand added during periods of cost pressure.
What is the 30/30/30 rule for restaurants?
Actual healthy ranges vary by concept, so treat it as a starting reference, not a fixed target.
What are the key metrics in restaurant analytics?
The key categories are financial (prime cost, food cost %, labor cost %), operational (SPLH, covers, table turnover), performance (RevPASH, contribution margin per cover), and customer metrics (retention rate, review ratings, visit frequency).
What are the 7 P's of marketing for restaurants?
The 7 P's, product, price, place, promotion, people, process, and physical evidence, are a general marketing framework adapted to restaurants, covering everything from menu design (product) to service quality (people) and ambiance (physical evidence).
How often should I check my restaurant's KPIs?
Check sales, labor percentage, and covers daily; check food cost, prime cost, and cash position weekly, since daily tracking on inventory-based metrics tends to add noise rather than useful signal.
How can I track all these metrics without extra spreadsheets?
A platform like RESTOBOT pulls ordering, reservation, and loyalty data into one dashboard, which cuts down the manual reconciliation that usually keeps owners from checking their numbers consistently.