

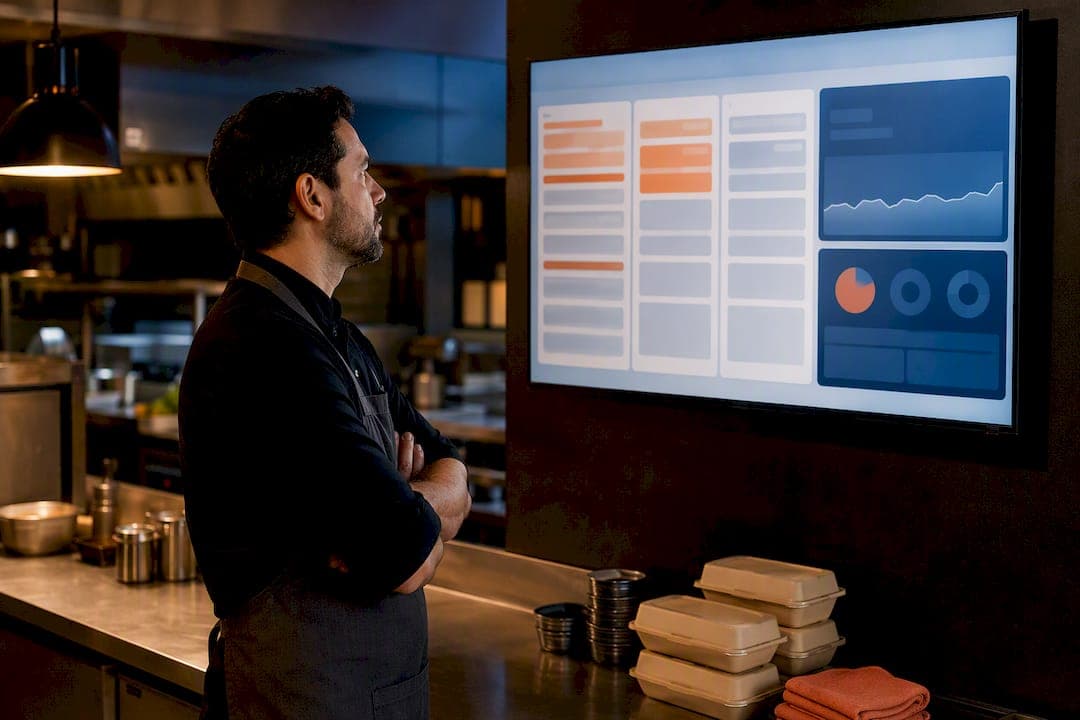
An effective restaurant order dashboard pulls every order (website, delivery apps, in-house POS, table QR) into one real-time view, then splits that data into role-specific screens: a kitchen board for cooks, a manager dashboard for owners, and a unified board for anyone tracking multichannel volume. If it doesn't update within seconds and separate kitchen speed from manager analytics, it's not doing its job. The sections below cover dashboard types, the KPIs worth watching, integration mechanics, and how to deploy one without wasting a quarter on the wrong stack.
***
TL;DR:
>
- Combining all order channels into a single dashboard requires reliable API or webhook integrations, with webhooks offering the lowest latency. - Kitchen screens should prioritize speed with minimal, time-sensitive information, while manager dashboards focus on trend analysis, alerts, and reports. - Accurate real-time data and role-specific views are more important than extensive integrations or feature overload for ensuring dashboard effectiveness. - Offline printer fallback and role-based access control are critical for security and operational continuity during outages. - Piloting the system during slow shifts helps identify issues like sync drift and duplicate orders, preventing costly mistakes during busy periods.
***
Table of Contents
- What Types of Restaurant Order Dashboards Do You Need?
- What KPIs Should an Order Dashboard Track?
- How Do POS, Payments, and Delivery Apps Feed Into the Dashboard?
- What Makes a Kitchen Dashboard Actually Usable Under Pressure?
- How Do You Choose and Deploy an Order Dashboard?
- How RESTOBOT Handles the Order Dashboard Checklist
- What Goes Wrong With Restaurant Order Dashboards (and How to Fix It)
- How Secure Is Order Data on a Restaurant Dashboard?
- How Do Order Dashboards Change the Way Staff Work Together?
- Where Is Order Dashboard Technology Headed Next?
- What the Data Actually Tells You to Prioritize
- Ready to Put Your Orders on One Screen?
- Sources
- FAQ
What Types of Restaurant Order Dashboards Do You Need?
Most restaurants eventually run three distinct dashboard views, not one screen trying to do everything.
The manager or owner dashboard rolls up sales trends, labor cost as a percentage of revenue, and multi-location comparisons. Analytics platforms built for this layer typically surface revenue by hour, item-level performance, and labor-cost percentage so a manager can see a slow Tuesday coming before payroll gets out of line.
The kitchen display system (KDS) strips all of that away. Cooks need ticket flow, prep timers, and station filters, nothing else. A dashboard cluttered with sales charts on a kitchen line just slows people down.
The unified order board exists for anyone juggling delivery apps alongside walk-ins and web orders. These boards consolidate marketplace orders into one color-coded feed with printable tickets, which matters most for multi-brand or dark-kitchen operations running several virtual concepts out of one line.
- Manager dashboards: trend tiles, multi-location rollups, exportable reports
- Kitchen displays: ticket queues, prep timers, station-specific filtering
- Unified order boards: cross-platform consolidation, color-coded source tags
- Mobile manager apps: on-the-go alerts, but weaker for deep trend analysis than a fixed screen
Fixed kitchen screens win on visibility during a rush; mobile apps win on flexibility for managers who split time between the floor and the office.
What KPIs Should an Order Dashboard Track?
A dashboard drowning in metrics is as useless as one with none. Five numbers actually change how a shift runs.
- Active orders — how many are open right now, broken out by state
- Average prep time — from kitchen acceptance to "ready," the number that predicts customer complaints before they happen
- Time to accept — how long an order sits before someone acknowledges it, especially critical for delivery-app orders where the courier is already timing out
- Order throughput — orders completed per hour, the figure that tells you if you're understaffed
- Average ticket — revenue per order, watched by managers more than kitchens
Real-time order tracking cuts response lag industry-wide. Dashboard vendors building for live operations consistently frame live feeds and shift monitoring as the baseline expectation, not a premium feature.
Order states matter as much as the numbers. A clean state machine looks like: new, accepted, in prep, ready, out for delivery or ready for pickup, completed. Kitchens watch prep time and throughput obsessively. Floor staff watch "ready" status so nothing sits under a heat lamp. Managers watch average ticket and daily trend tiles, rarely the individual ticket queue.
How Do POS, Payments, and Delivery Apps Feed Into the Dashboard?
Order data arrives from four places: your own website or app, third-party marketplaces, your POS terminal, and table QR codes. Getting all four into one board without lag is where most dashboard projects actually break.
Three integration methods handle this in practice. Webhooks push order events the instant they happen, the standard for delivery-platform integrations. Polling checks a source on an interval, useful as a fallback but never as fast. Middleware connectors sit between your POS and the dashboard when the two systems don't speak the same protocol natively, which is common with older POS hardware.
Printer integration deserves its own attention because it's the piece most likely to fail mid-shift. Kitchen printers need offline fallback: if the dashboard loses connectivity, tickets should still print from a local queue rather than vanish. Vendors serving real deployments consistently flag POS sync and courier API connectivity alongside printable ticket support as baseline trust signals, not extras.
- Website and app orders: usually webhook-driven, the lowest latency
- Marketplace orders (delivery apps): webhook or API polling, variable reliability by platform
- POS terminal sync: often middleware-dependent on legacy hardware
- Table QR orders: direct API call into the same order queue as web orders
Pro Tip: *Test your printer's offline queue before your first real rush, not during it. Pull the network cable for thirty seconds and watch whether tickets still print when connectivity returns.*
Latency matters more than most owners assume. A dashboard that's accurate but thirty seconds behind will still cause a kitchen to double-fire an order. Anything beyond a few seconds of lag on order acceptance is worth escalating to whoever manages your integration.
What Makes a Kitchen Dashboard Actually Usable Under Pressure?
Design choices that look fine in a demo often fall apart during a Friday dinner rush. The fix is almost always subtraction, not addition.
Kitchen tickets should show only what a cook needs in the next ninety seconds: item, modifiers, table or order number, and a timer. Priority sorting (oldest ticket first, or rush orders flagged) beats a chronological list nobody has time to scan. Design references for food-delivery dashboards increasingly favor tablet-first kitchen screens with dark mode, which cuts glare and eye strain during long shifts.
Manager dashboards flip the priority. Trend tiles, anomaly alerts (a sudden spike in voided orders, say), and quick date filters matter more than raw ticket lists. Color-coding does real work here too: green for on-time, yellow approaching a threshold, red for late. That one visual cue lets a floor manager scan a screen from across the room instead of reading every line.
- Kitchen view: minimal fields, large timers, priority-first sorting
- Manager view: trend tiles, alert badges, exportable filters by date or channel
- Color-coding: consistent state colors across every screen in the building
- Accessibility: high contrast for kitchen environments, large tap targets for touchscreens with wet or gloved hands
How Do You Choose and Deploy an Order Dashboard?
Start with scope, not software. How many channels are you consolidating? One location or five? That answer decides everything downstream.
- List every order channel you need to ingest, website, delivery apps, POS, table QR, and confirm each has a usable API or webhook.
- Decide build vs. buy. Open-source restaurant management repositories on GitHub can jump-start a custom build, but budget real developer time for maintenance, not just launch.
- Pick a deployment shape: cloud SaaS (fastest, lowest upfront cost), a self-hosted template (more control, more maintenance), or a fully custom stack (most flexible, slowest to ship).
- Map cost beyond the subscription fee. Printer hardware, POS integration work, and staff training are the expenses that blow past initial quotes.
- Run a one-shift pilot. Measure prep time and error rate before and after, on the same day of week if possible, so the comparison actually means something.
Hidden integration costs are the single biggest budget surprise. A dashboard that quotes a flat monthly fee often bills separately for POS connector setup or courier API access.
Pro Tip: *Pilot with your slowest shift first, not your busiest. You'll catch configuration errors without losing orders to them.*
How RESTOBOT Handles the Order Dashboard Checklist
RESTOBOT builds most of that checklist in directly. Orders from the website and Telegram bot land in one real-time dashboard alongside table QR and reservation activity, so there's no middleware project to fund separately. Delivery coordination runs through courier partners like Wolt Drive, and because RESTOBOT charges zero commission on orders, the revenue you see on the dashboard is the revenue you keep. Deployment typically goes live within a day of application confirmation rather than the weeks a custom build demands. Plans and current pricing are on the RESTOBOT pricing page.
What Goes Wrong With Restaurant Order Dashboards (and How to Fix It)
Most dashboard failures aren't software bugs. They're mismatches between what the tool does and what the shift actually needs.
Order duplication tops the list. When a dashboard pulls from both a delivery-app webhook and a manual POS entry for the same order, kitchens end up firing it twice. The fix is a single source of truth per order ID, enforced at the integration layer, not patched over with staff training.
Alert fatigue kills adoption fast. A dashboard that pings for every minor delay trains staff to ignore all alerts, including the ones that matter. Reserve alerts for real thresholds: an order sitting unaccepted for more than two minutes, not every ticket that crosses an arbitrary timer.
Screen clutter during rushes is a design failure more than a technical one. If a kitchen screen shows the same information at 2pm and 8pm, it wasn't built for peak volume. Priority sorting and collapsed views for completed orders keep the active queue readable when forty tickets are in play.
Sync drift between POS and dashboard happens more with older POS hardware that relies on polling instead of webhooks. If your dashboard shows an order as "new" for a full minute after the POS already accepted it, that's a polling interval problem, not a dashboard bug. Ask your integration provider what refresh interval they use and whether webhooks are available for your specific POS model.
Multi-location confusion shows up when managers overseeing several venues can't tell which location a spike belongs to without extra clicks. Location tagging needs to be visible on every tile, not buried in a filter menu.
Most of these get caught in a single pilot shift, which is exactly why running one before full rollout matters more than reading another feature list.
How Secure Is Order Data on a Restaurant Dashboard?
Order dashboards handle more sensitive data than most owners realize: customer names, phone numbers, delivery addresses, and payment details all pass through the same system that's showing a cook a ticket queue.
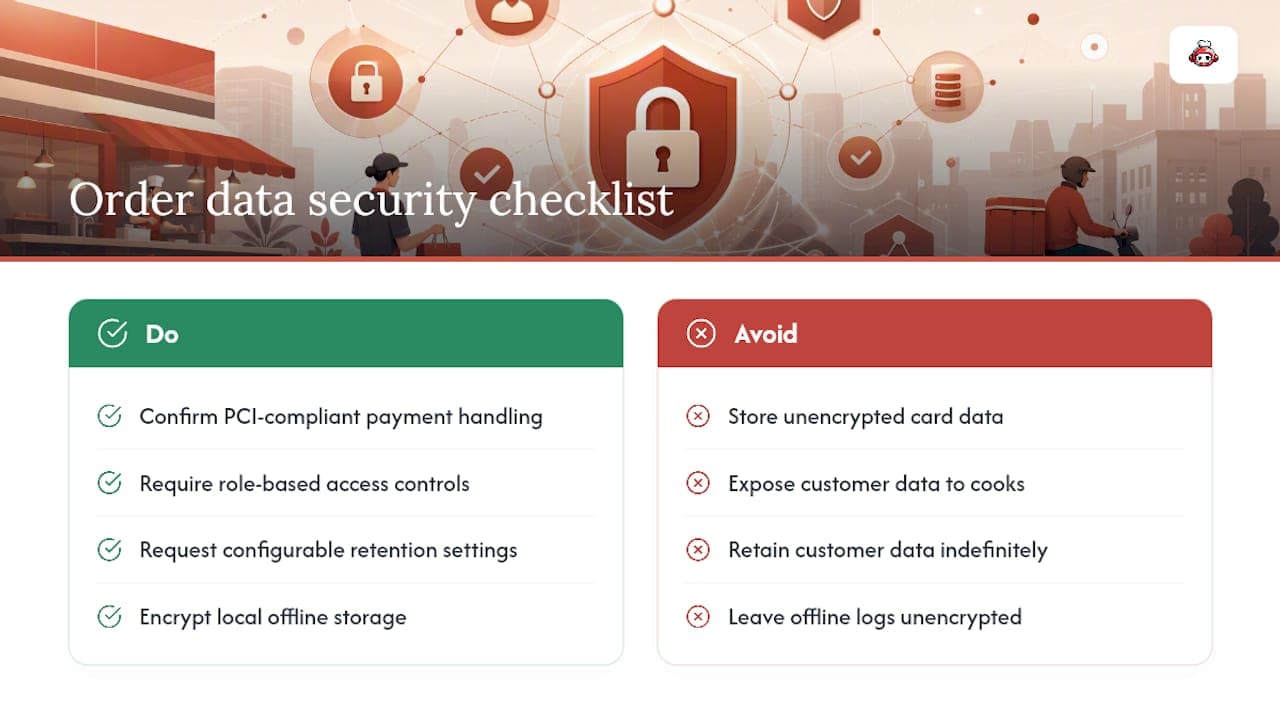
Payment data should never sit unencrypted in your dashboard's database. Any system processing cards directly needs PCI DSS compliance, and most SaaS dashboards handle this by routing payment data through a certified processor rather than storing card numbers themselves, worth confirming explicitly with any vendor before signing.
Role-based access matters just as much as encryption. A line cook doesn't need to see customer phone numbers, and a delivery driver's app shouldn't expose your daily revenue totals. Dashboards that separate views by role, kitchen sees tickets, managers see analytics, aren't just a UX choice. They're also a data-minimization practice that limits exposure if one device gets lost or one login gets compromised.
Data retention is the piece owners forget until a customer asks about it. Customer order history, delivery addresses, and loyalty data fall under privacy regulations in most jurisdictions (GDPR in the EU, various state laws in the US), which generally require you to disclose what you collect and, in many cases, delete it on request. Ask any dashboard vendor directly how long they retain order and customer data, and whether that retention period is configurable.
Offline fallback systems, useful for keeping tickets printing during an outage, create their own risk if they store order data locally without encryption. A lost or stolen POS terminal with unencrypted local order logs is a real exposure, not a theoretical one.
None of this means avoiding cloud dashboards in favor of paper tickets. It means asking vendors direct questions about encryption, access control, and retention before deployment, not after an incident.
How Do Order Dashboards Change the Way Staff Work Together?
The biggest shift a dashboard creates isn't speed. It's what happens to communication between the kitchen, the floor, and management once everyone stops relying on shouted updates and paper tickets.
Kitchens historically ran on verbal handoffs: a server calling out a rush order, a cook yelling "ready" across the line. A shared dashboard replaces most of that with visual state changes anyone can see from across the room. That reduces noise, but it also removes a layer of human context, so tickets need clear priority flags to replace what a server's tone of voice used to communicate.
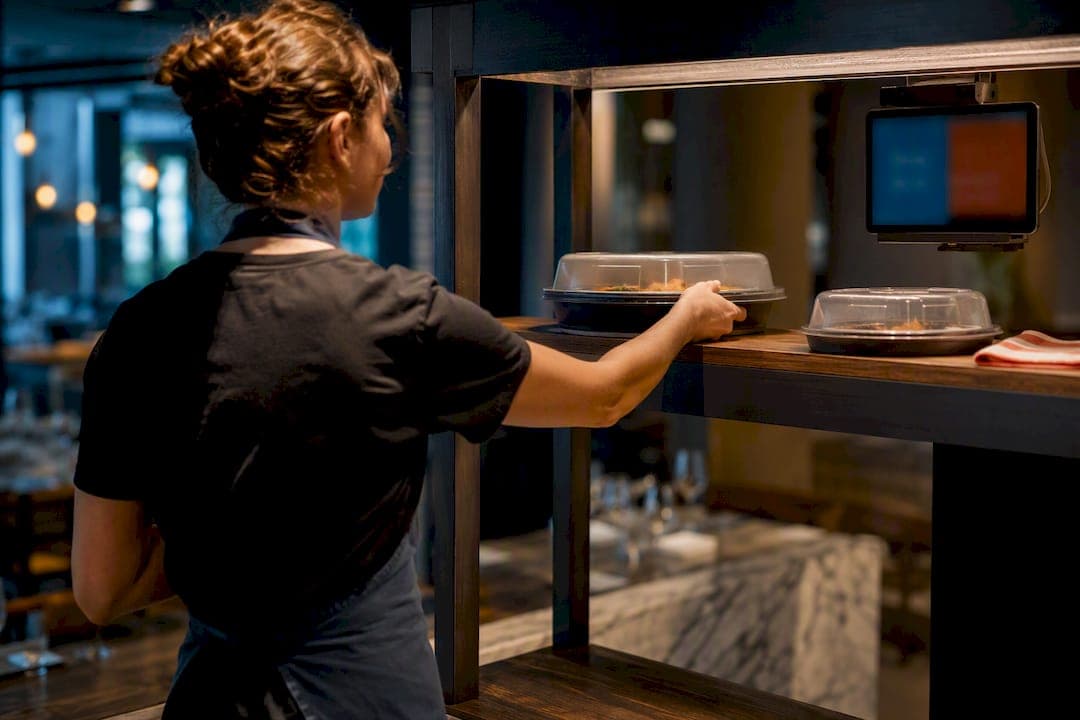
Floor staff benefit most from the "ready" state. Instead of walking back to the kitchen to check, a server glances at a screen or gets a mobile alert. That single change often cuts food sitting under a heat lamp, since staff no longer discover a ready order by accident.
Managers gain something different: a paper trail. When an order runs late, a dashboard shows exactly where it stalled, at acceptance, during prep, or at handoff to a courier, instead of relying on staff memory after the fact. That visibility changes how performance conversations happen. Coaching a cook on prep time becomes a data conversation instead of a guess.
The friction shows up during onboarding. Staff used to shouting across a kitchen sometimes resist a screen-based system, and adoption depends heavily on keeping the kitchen-facing interface simple enough that it doesn't feel like extra work layered onto an already fast-paced shift. Dashboards that succeed here tend to be the ones cooks forget they're using because the interface asks so little of them.
Where Is Order Dashboard Technology Headed Next?
Predictive prep timing is the most immediate shift underway. Instead of a static "average prep time" metric, dashboards are starting to forecast how long a specific order will take based on current kitchen load and item mix, letting a system quote a more accurate delivery estimate to the customer up front rather than a generic thirty-minute default.
Voice and hands-free interfaces are creeping into kitchen environments where touchscreens are impractical with wet or gloved hands. A cook calling out "order forty-two ready" to a system that updates the board automatically removes one more physical interaction from an already busy line.
Deeper POS-to-dashboard convergence is also underway. The line between "POS system" and "order dashboard" is blurring as vendors bundle payment processing, kitchen display, and analytics into single platforms rather than requiring three separate integrations, which addresses exactly the middleware headaches covered earlier in this piece.
Cross-platform order consolidation will likely deepen too. As more restaurants run multiple virtual brands out of one kitchen, unified boards that already handle multi-brand order consolidation are positioned to add more granular routing, sending each virtual brand's tickets to the right station automatically instead of relying on a cook to sort by restaurant name.
None of this replaces the fundamentals covered above. A dashboard with predictive AI and voice controls still fails if it can't reliably tell a kitchen which order came in first. The core job, real-time accuracy and role-appropriate views, stays the constant even as the interface around it gets more sophisticated.
What the Data Actually Tells You to Prioritize
Most advice on restaurant dashboards leads with features: analytics, AI predictions, loyalty integrations. That's backward. The research behind this piece points somewhere more boring and more useful: separation of views is what actually determines whether a dashboard gets used or ignored within a month.
Managers want trend tiles and exportable reports. Kitchens want speed and almost nothing else. The dashboards that fail are usually the ones that try to serve both audiences on one screen, figuring a single unified view is more efficient. It isn't. It's just more cluttered for the people who need speed most.
The other overrated idea is that more integrations automatically mean a better system. A dashboard connected to six delivery platforms but riddled with sync drift and duplicate tickets is worse than one connected to two platforms that actually work reliably. Reliability of the connections you have beats the number of connections you're bragging about.
If you take one thing from this guide, pilot before you commit. One real shift, measuring prep time and error rate, tells you more than any demo video or feature comparison ever will.
*— ADMIN*
Ready to Put Your Orders on One Screen?
If you've been comparing custom-built dashboards against ready-made templates, there's a third path worth weighing: a platform that already ships the dashboard, the ordering channels, and the delivery coordination together, with none of the per-order commission that marketplace apps like Uber Eats or Glovo charge. Some platforms consolidate website orders, chatbot orders, and table QR orders into one real-time dashboard, which can be deployed rapidly compared to a custom stack. Plans come in multiple tiers with prices detailed on the RESTOBOT pricing page, detailed on the RESTOBOT pricing page. Staff can also set up commission-free digital tipping independent of which plan the restaurant runs, covered on the tips product page. Check the plan that matches your channel count and get your dashboard running this week.
Sources
A handful of resources are worth keeping open while you evaluate options. Roundups of restaurant dashboard templates give developers a starting point for custom builds without a monthly fee. Feature-overview posts like this orders and sales management breakdown help non-technical owners compare capabilities quickly. For kitchen-side operations, this piece on cutting ticket times with station-level changes pairs well with the UX section above.
FAQ
What Is a Restaurant Order Dashboard?
A restaurant order dashboard is a centralized screen or app that shows incoming orders in real time, typically split into a kitchen view for prep and a manager view for sales and staffing analytics.
Do I Need Separate Screens for the Kitchen and Management?
Yes, in most cases. Kitchens need minimal, timer-driven ticket views, while managers need trend data and exportable reports, and combining both on one screen tends to clutter the interface for both audiences.
How Much Does a Restaurant Order Dashboard Cost?
Costs vary widely by deployment type, from free open-source templates requiring developer time to subscription platforms. RESTOBOT's plans run €49 to €199 per month depending on the tier, listed on its pricing page.
Can a Dashboard Reduce Commission Fees From Delivery Apps?
Some platforms offer commission-free order processing on their own channels.
What's the Fastest Way to Deploy an Order Dashboard?
Cloud SaaS platforms deploy fastest, often within a day, compared to custom builds that require weeks of development and integration work. Certain services activate live dashboards shortly after an application is confirmed, enabling rapid deployment compared to custom builds.